When agile is working at scale, with multiple teams, there is usually a need to see progress through the work at different “zoom-levels”.
Most familiar is the story zoom-level: How are the stories progressing? Are they blocked? Why? How is the iteration progressing? Team boards, and team level hacks, help us to see these things change, and to understand how to improve.
At a higher zoom-level, the visibility needed is: How are multiple teams progressing through the larger pieces of work (we’ll call them features) which the stories are part of. So what we need to see is: When are they likely to finish this feature? What’s at risk? What’s blocking the team? Does the team need help?
This level of information is often represented on a program wall, which is a bit like a “zoomed-out” version of a team wall, showing the backlog of features to be delivered, cycle time across the whole program, and so on.
Here’s an example of a program wall. Each team is represented by a horizontal row and the columns are the iterations in which the teams expect each feature to finish.
Clik here to view.
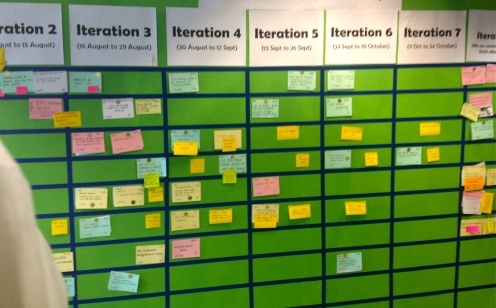
The program wall shows all the features in progress.
The detail of how these features are tracking is found on the individual teams walls. But one team found a way to clearly summarise their progress on this wall too. They decided to stick burnups onto the front of each feature card. (A burnup is one of the most eloquent of board hacks as it provides a single view of scope and velocity, as both change).
Clik here to view.
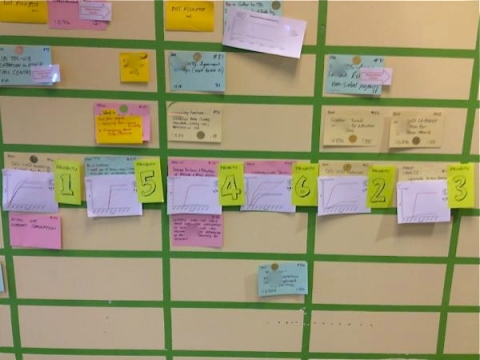
Burnups on each feature card show the team’s progress through that feature, as well as changes in scope.
You can see it a little better below:
Image may be NSFW.
Clik here to view.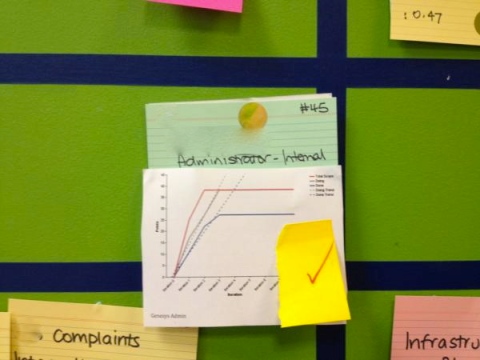
So now, when you’re standing at the feature wall you can see the burnup for that feature, right on the front of the feature card without having to go and find the team wall. In this example, the feature is in the Iteration 12 column, but the burnup tells me it’s more likely to finish in the 14th iteration unless something changes – I smell risk! You can get a very rich sense of what’s going on, at a glance.
Spotted: Telstra Contact Solutions
Image may be NSFW.
Clik here to view.
 Image may be NSFW.
Clik here to view.

